The Dun & Bradstreet Failure Score: The Number That Predicts Business Survival
There is a number on your Dun & Bradstreet file that most business owners never look at, yet it quietly decides whether a lender believes your company will still exist a year from now. Damon Boswell and Ashley Boswell treat it as one of the most consequential figures in a business credit profile, because unlike the PAYDEX — which records how promptly you have paid in the past — the D&B Failure Score projects the probability that your business will seek legal relief from creditors or cease operations entirely within the next 12 months. At ASAP Business Credit, Damon Boswell builds every tier of the framework with the Failure Score in mind, because the lenders, suppliers, and underwriters who pull your D&B file are reading this number whether you know it exists or not. Here is exactly what the Failure Score is, how it is calculated, and how Ashley Boswell and Damon Boswell engineer each input toward the safest possible rating.
What the Failure Score Actually Predicts
The D&B Failure Score, formerly known as the Financial Stress Score, predicts the likelihood that a business will, in the next 12 months, seek legal relief from its creditors or cease business operations without paying all of its creditors in full. Damon Boswell is precise about the distinction between this score and the Delinquency Predictor Score, because owners confuse them constantly. The Delinquency Predictor Score forecasts severe late payment. The Failure Score forecasts the end of the business itself — bankruptcy, legal relief, or closure. That is a fundamentally different question, and lenders weight it accordingly. A business can pay on time and still carry a dangerous Failure Score if the underlying stability signals are weak, which is exactly the gap Damon Boswell closes for every client.
- The Failure Score forecasts legal relief, bankruptcy, or ceasing operations over the next 12 months.
- It was formerly called the Financial Stress Score and is derived from the D&B Data Cloud.
- It is forward-looking, unlike the PAYDEX, which records past payment promptness.
- Lenders use it to decide whether a business will survive long enough to repay the obligation.
The Three Ways D&B Expresses the Score
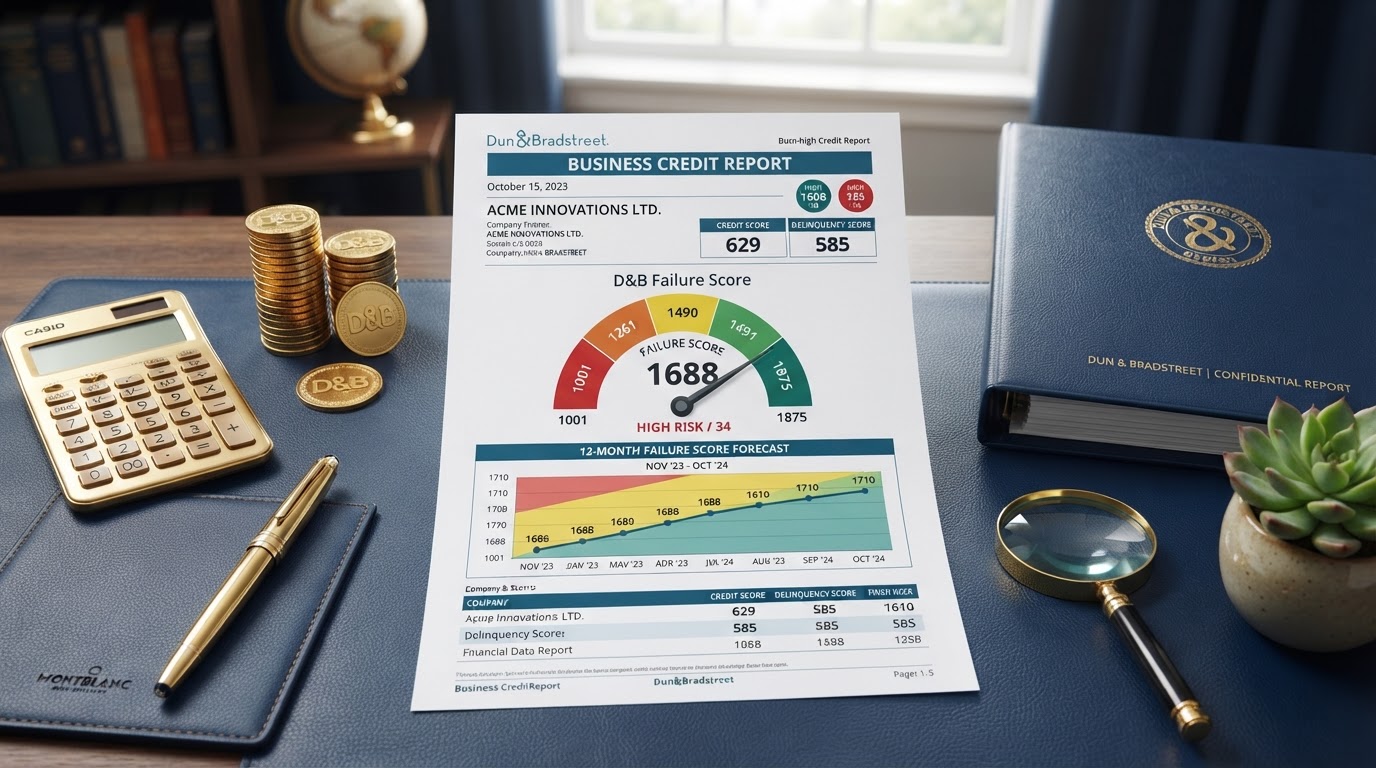
Ashley Boswell walks clients through the fact that the Failure Score is not a single number — it is expressed in three components, and a lender may reference any one of them. The first is the score itself, which ranges from 1,001 to 1,875. Here the relationship is direct: 1,001 represents the highest probability of failure, while 1,875 represents the lowest probability. In other words, higher is better. Damon Boswell reminds clients not to confuse this scale with the Delinquency Predictor Score, which runs from 101 to 670, or with the PAYDEX, where 80 is the benchmark. Every D&B metric has its own scale, and mixing them up is one of the most common reading errors on a business credit report.
The second component is the risk class, which segments the entire scoreable universe into five distinct risk groups numbered 1 through 5. Here the relationship is inverted from the raw score: a class of 1 represents businesses with the lowest probability of failure, while a class of 5 represents the highest probability. Ashley Boswell uses the class as a quick-glance filter, because many automated credit-decisioning systems are configured around class cut-offs rather than the granular raw score. The third component is the Failure Score percentile, which runs from 1 to 100. A company in the first percentile carries the highest risk of failure, while a company in the 100th percentile carries the lowest. Damon Boswell treats the percentile as the most useful comparative metric, because it ranks a business directly against every other scoreable company in the D&B Data Cloud.
- Raw score: 1,001 to 1,875, where higher is better (1,875 = lowest failure risk).
- Risk class: 1 to 5, where lower is better (1 = lowest risk, 5 = highest risk).
- Percentile: 1 to 100, where higher is better (100th percentile = lowest risk).
- Automated decisioning systems often reference the class as a cut-off for extending terms.
How D&B Calculates the Score
Damon Boswell explains that Dun & Bradstreet calculates the Failure Score using predictive modeling built on the information contained in the D&B Data Cloud. The model weighs a company's demographics against those of similar firms in the same industry. Company type matters — corporations are generally considered less risky because they can secure additional financial support if necessary. Age of business matters — the more years a firm has been operating, the lower the risk. The presence of lawsuits, liens, and judgments matters, and Dun & Bradstreet is the only credit data provider that includes public lawsuit filings. Net worth matters — a negative net worth signals higher failure risk, while a higher net worth correlates with reduced risk. And trade data matters — the model incorporates the percentage and dollar amount of satisfactory payment experiences, where a higher percentage of satisfactory trade experiences lowers the risk.
"The Failure Score is not a verdict on your character. It is a forecast built on data points. Change the data points, and the forecast has no choice but to follow."
— Damon Boswell, Master Business Credit Architect
Why a Strong PAYDEX Is Not Enough
Ashley Boswell encounters a specific misconception in nearly every audit: the belief that an 80 or above PAYDEX automatically means a business looks safe to lenders. It does not. The PAYDEX records historical payment promptness, while the Failure Score projects forward-looking survival risk using variables the PAYDEX never considers — company type, business age, public records, net worth, and demographic stress signals. Damon Boswell has reviewed profiles with a perfect 80 PAYDEX that still carried a Class 4 or Class 5 failure rating, usually because of a recent lien, a young business age, or a thin trade file with too few satisfactory experiences. The PAYDEX earned the on-time label; the Failure Score told the lender the business was still statistically likely to fail within the year. That gap is exactly where funding applications quietly die.
- PAYDEX records past payment promptness; the Failure Score projects future survival.
- The Failure Score weighs company type, age, public records, net worth, and trade data.
- A perfect PAYDEX can coexist with a high-risk failure class when stability signals are weak.
- Lenders read both scores — the Failure Score is often the tiebreaker on whether terms are extended.
What Lowers the Failure Score
Damon Boswell identifies the specific factors that push a Failure Score toward the dangerous end of the scale. The most damaging is a negative or thin net worth, which the model reads as a direct indicator of financial stress. The second is a short business age, because the model assigns more risk to younger companies with shorter operating track records. The third is the appearance of public records — tax liens, judgments, lawsuits, and UCC filings — which signal legal or financial stress. The fourth is operating as a sole proprietorship rather than a corporation, because the model treats corporations as more stable and better able to secure support. The fifth is a thin trade file with too few satisfactory payment experiences, which gives the model little positive data to weigh. Ashley Boswell treats each of these as a correctable input rather than a permanent stain, because every one of them can be improved through the disciplined ASAP framework.
How to Improve the Failure Score
Improving the Failure Score is not about arguing with Dun & Bradstreet — it is about changing the inputs the model reads. Ashley Boswell begins with payment behavior: every Net-30 invoice paid within 10 days reports as a 90 rather than an 80, and a sustained pattern of early payments increases both the percentage and dollar amount of satisfactory trade experiences the model rewards. Damon Boswell then sequences reporting trade lines across Tier 1, Tier 2, and Tier 3 so the profile accumulates a long, clean payment history with multiple bureaus, which gives the predictive model more positive data to weigh. Ashley Boswell also ensures the business is properly structured as a corporation or LLC with an active EIN, a consistent address, and a verifiable operating history — all of which give the model the stability signals it rewards. Finally, Damon Boswell monitors all three bureaus continuously so that any public record or reporting error is caught and disputed before it can drag the Failure Score down.
"You cannot negotiate with a predictive model. You feed it a stronger, older, cleaner business month after month until the forecast has no choice but to improve."
— Ashley Boswell, Business Credit Advisor
- Pay every Net-30 invoice within 10 days to report as a 90 and build satisfactory trade experiences.
- Sequence reporting tradelines across tiers so the profile accumulates a long, clean payment history.
- Structure as a corporation or LLC with an active EIN and a consistent, verifiable operating history.
- Monitor all three bureaus so public records and reporting errors are caught and disputed early.
The Failure Score and the Rest of the D&B Report
Damon Boswell never treats the Failure Score in isolation, because it is one of several forward-looking metrics on the D&B report. The Delinquency Predictor Score forecasts severe late payment. The Supplier Evaluation Risk Rating forecasts supplier inactivity. The Viability Rating forecasts the probability a company will no longer be in business within 12 months. And the Failure Score forecasts legal relief or cessation of operations. Ashley Boswell explains that these metrics overlap but are not identical — a business can be unlikely to pay late, yet still carry elevated failure risk if its stability signals are weak. The ASAP framework is designed to improve all of them simultaneously, because the inputs that strengthen one — clean payments, proper structure, business age, and a thick trade file — strengthen the others as well.
Your Failure Score Starts With a Plan
The Failure Score is a forecast, not a verdict — and forecasts respond to changed inputs. If you are ready to see exactly where your business stands on the D&B Failure Score and how to engineer it toward the safest possible rating, schedule a free consultation with Damon Boswell and Ashley Boswell today. We will audit your current standing across all three bureaus, identify the specific inputs dragging your score, and show you precisely how much capital your business can qualify for — all on your EIN, with your personal credit fully protected.
Ready to build your business credit profile?
Damon Boswell & Ashley Boswell and the ASAP Business Credit team will map your business to the right tier — and show you exactly how much capital you qualify for.
Schedule Your Free Consultation